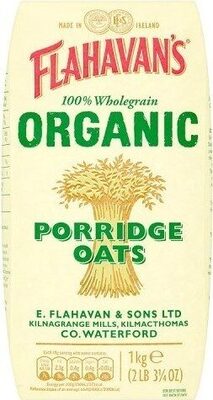
Flahavan's Organic Porridge Oats
Flahavan's
96
/100
Sláinte Score
Excellent
Short list, real food, nothing hiding.
- Low in sugars
- Low in saturated fat
- Low in salt
- Fits a balanced diet
How Sláinte turns a food label into a score.
We read three things on the label: the nutrition, the ingredients and how processed the food is. Then we compare it with similar products, so a cereal is judged against cereals and a sauce against sauces.

What the colours mean
Both sit on the cereal shelf. One is plain oats. The other is mostly sugar, with added colourings.
Better choice · 1 of 2
This is exactly what you would see after scanning each one. Both are scored on the real label.
Highest possible score 74, if it has artificial sweeteners
Highest possible score 74, if it has processed meat, such as sausages, ham or bacon
Highest possible score 49, if it has fried savoury snacks, such as crisps
Highest possible score 49, if it has dense sauces and condiments, such as mayonnaise
Highest possible score 49, if it has processed meat with sulphites, nitrites or phosphates added
Highest possible score 24, if it has cakes, pastries, biscuits or sweets
Highest possible score 20, if it has alcohol
Each dark bar shows the highest score a product can get if it breaks that rule. Even if everything else on the label is fine, it cannot go past that number.
This example is calculated from the saved label record for barcode 5099801003315 using the same scoring function as the product page. Nothing below is a hand-written estimate.
Nutrition 55%, ingredients 30%, processing 15%.
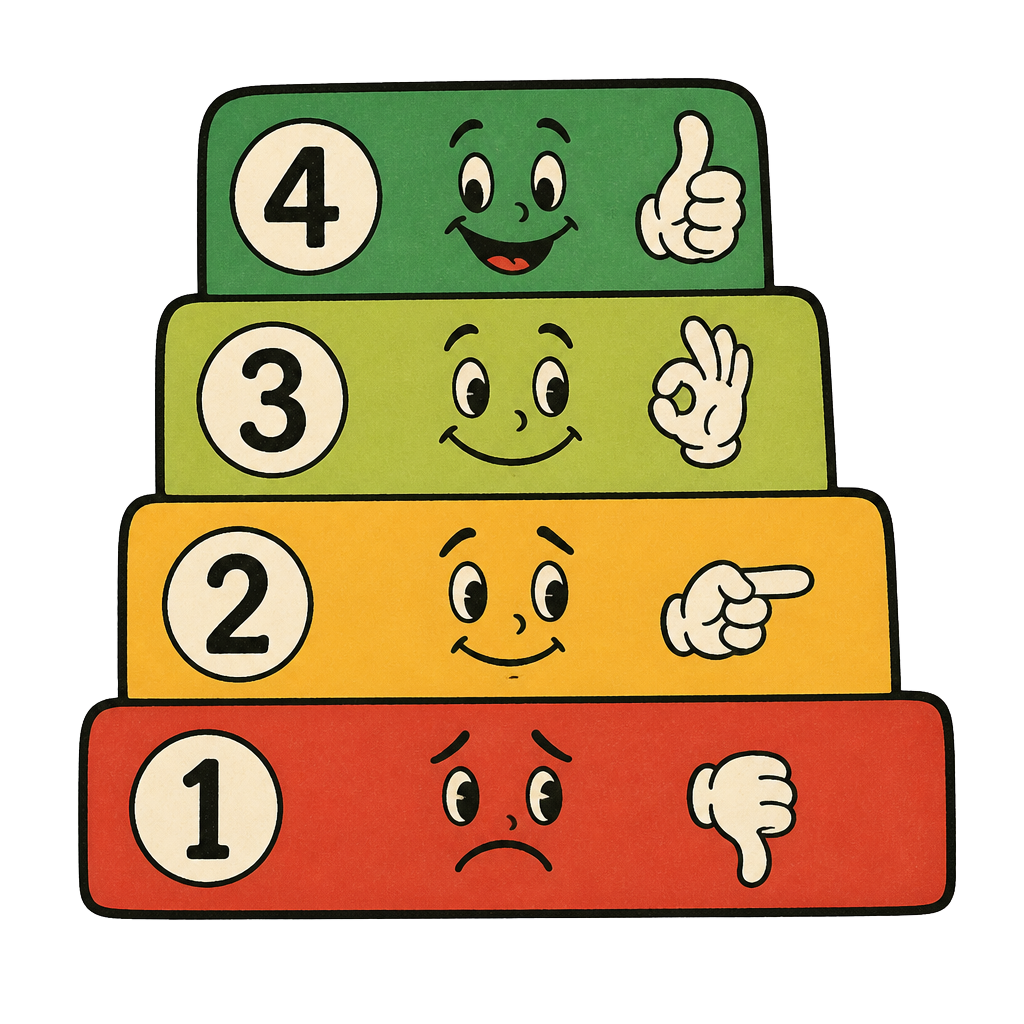
The same four colours and cutoffs everywhere in Sláinte, never tuned per product.
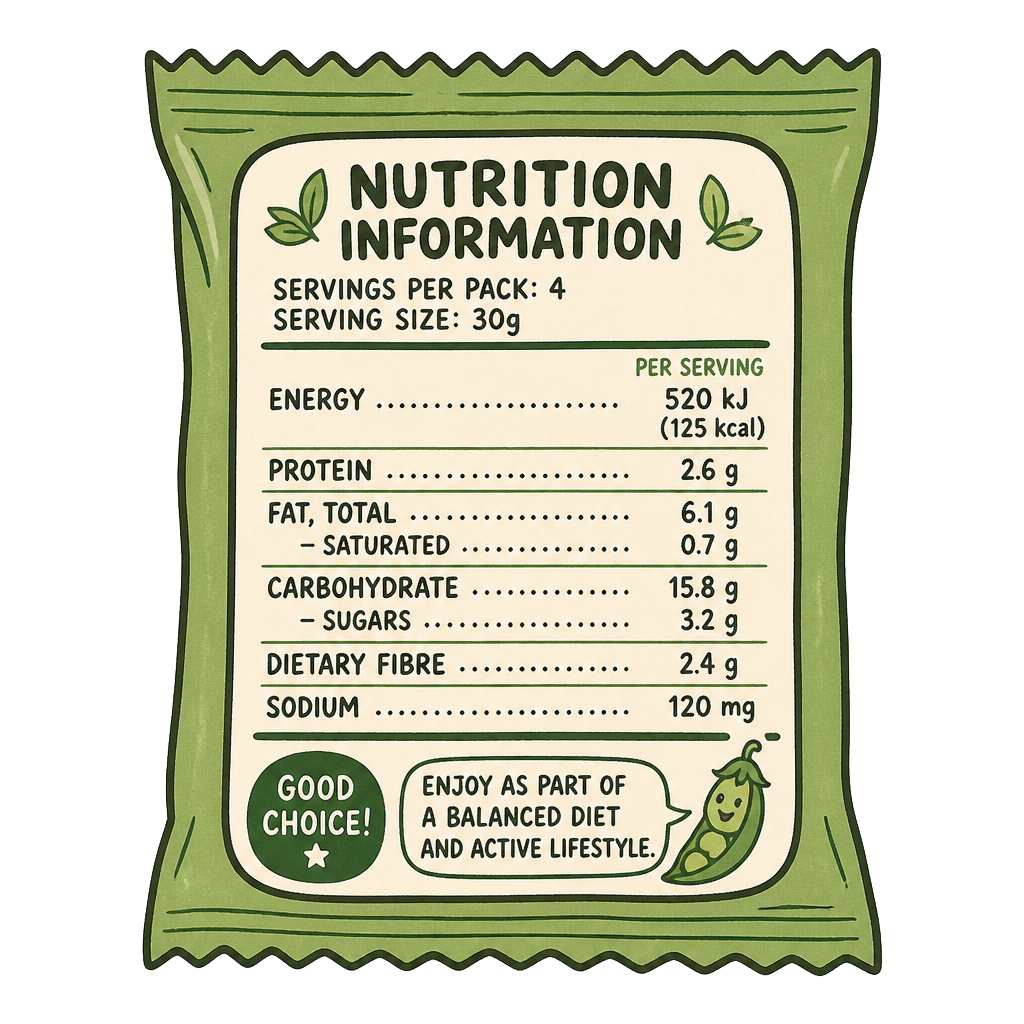
Derived from the 2023 Nutri-Score nutrient profiling model, with published Sláinte modifications, using the figures printed on the pack.

Caps and floors that stop a category gaming the calculation.
Every food score out of 100 is built from three parts. These are the exact shares the app uses.
Nutrition quality
55%
Ingredients
30%
Processing and quality signals
15%
| Part | Share | What it measures | Why it carries this weight |
|---|---|---|---|
| Nutrition quality | 55% | Energy, sugars, saturated fat and salt, set against fibre, protein and fruit, vegetable and pulse content. | It is the part of a product that is actually measured and printed on the pack, so it compares fairly across every brand. |
| Ingredients | 30% | Additives, artificial sweeteners, how long the ingredient list is and whether any ingredient is a known concern. | Two products with the same nutrition figures are not equal if one of them is mostly additives. |
| Processing and quality signals | 15% | How processed the food is (its NOVA group) and how long the ingredient list runs. Fibre and protein are already counted in the nutrition part, so they are not counted again here. | A supporting signal that nudges the result, never a verdict on its own. |
The final number falls into one of four bands. The cutoffs never move.
| Band | Score | What we say | What it means |
|---|---|---|---|
| Excellent | 75 to 100 | Good for you. | A strong overall profile according to the Sláinte methodology. |
| Good | 50 to 74 | Mostly good for you. | A generally favourable profile, with some characteristics worth understanding. |
| Poor | 25 to 49 | Best kept occasional. | A weak profile. Several characteristics pull the score down. |
| Bad | 0 to 24 | Avoid. | A poor profile according to the Sláinte methodology. |
Sláinte’s nutrition component is derived from the 2023 Nutri-Score nutrient profiling model, with published Sláinte modifications for our 0–100 system and category guardrails. The published model adds points for the things worth limiting and takes them away for the things worth having, with separate thresholds for drinks, fats and oils and cheese. Our modifications: the salt scale keeps going past 4 g per 100 g, and the raw total is mapped onto 0 to 100. The final Sláinte Score then combines that with ingredients and processing, and applies the caps and floors below.
Counts against the score
Salt
up to 34 points
Sláinte extends the scale past 4 g per 100 g
Sugars
up to 15 points
Lower thresholds again for drinks
Energy
up to 10 points
Kilojoules per 100 g or 100 ml
Saturated fat
up to 10 points
Measured as a share of total fat for oils
Counts for the score
Protein
up to 7 points
Not counted when negatives are already high, cheese aside
Fibre
up to 5 points
Rewarded from 3 g per 100 g upwards
Fruit, vegetables and pulses
up to 5 points
Up to 6 for drinks
| Term | What it means here |
|---|---|
| Negative points | Points from energy, sugars, saturated fat and salt per 100 g or 100 ml. More points is worse. |
| Positive points | Points from fibre, protein and fruit, vegetable and pulse content, subtracted from the negative total. |
| The protein rule | Protein points are not counted once a product is already high in negatives, so a salty, fatty product cannot buy its way back with protein. Cheese is the exception. |
| The salt extension | The published salt scale stops at 4 g per 100 g, which makes table salt look like a salty sauce. Sláinte keeps counting beyond that point. |
| Mapped to 100 | The points total is converted to a 0 to 100 nutrition score, so a lower points total becomes a higher Sláinte number. |
Some categories look better per 100 g than they are in real life. These caps and floors are applied after the calculation.
| Rule | Why |
|---|---|
| A product finishes at most 15 points above its own nutrition score | A short, clean ingredient list cannot rescue poor nutrition. |
| Artificially sweetened products stop at 74 | Swapping sugar for sweeteners is not the same as a genuinely good product, so it is never shown as Excellent. |
| Dense sauces, dressings and condiments stop at 49 | Per 100 g figures flatter things eaten by the spoonful. |
| Fried and extruded savoury snacks stop at 49 | Crisps are crisps, whatever the pack says about them. |
| Dense cakes, pastries, biscuits and confectionery stop at 24 | A donut with missing nutrition data is still a donut. |
| Single ingredient, additive free, unprocessed foods never fall below 55 | Honey, nuts, plain yoghurt and olive oil are never ranked under an ultra processed snack. |
| A high concern ingredient overrides the headline verdict shown with the score | The verdict becomes "Avoid, contains a high concern ingredient." The underlying numerical score and band remain visible so you can see both the overall product profile and the specific ingredient warning. |

Sláinte does not treat missing information as a clean label. An unknown ingredient list receives a neutral value, confidence falls when core fields are absent, and a product with too little reliable information is left unscored rather than guessed.
A manufacturer may reformulate the product, a more complete label record may replace an older one, or the published method may be updated. Sláinte scores the information attached to the exact barcode and explains the factors used at that time.
There is no universal scanner score. Apps choose different nutrition models, ingredient classifications, processing rules, weights and category limits. The useful test is whether a method is public, consistent and explains its result.
Per 100 g figures and short ingredient lists can flatter products such as condiments, confectionery, alcohol or breaded foods. Published caps stop one favourable part of the label from overwhelming the product's overall purpose and profile.
Check that the barcode, product name, ingredients and nutrition match the pack in your hand. A different flavour or reformulated recipe can look almost identical. If the record is wrong, report the current label so it can be reviewed against the same published rules.
Every score is worked out by these rules and nothing else. Brands cannot pay for a better score or a place in the swaps. If you think we got one wrong, tell us and we will check it.