01
Use product information
Sláinte scores information that can be traced to the product label or another clearly identified data source.
How Sláinte turns product information into a score.
The Sláinte Score summarises product information in a way that is easy to understand and compare. The methodology is always published so you can see what the score is built on.
Sláinte scores information traceable to the label, applies category specific logic, weighs multiple factors rather than one nutrient, explains every result, and avoids implying more precision than the data supports.

01
Sláinte scores information that can be traced to the product label or another clearly identified data source.
02
A protein bar and a breakfast cereal do not serve the same role, so category specific logic matters.
03
The score is not driven by a single nutrient. Protein, fibre, sugar, saturated fat, salt, energy and ingredient characteristics all contribute.
04
Every score is accompanied by a human readable explanation of why the product scored the way it did.
05
A score of 81 versus 82 can imply more precision than the data supports, so small differences are not presented as meaningful.
06
The exact weighting is published on this page once the methodology is final.
We don't hide the formula. Our scoring combines nutritional quality, ingredient risk, processing indicators, and category-specific guardrails. If you think we've got something wrong, we want to know.
Nutrition 55%, ingredients 30%, processing 15%.
The same four colours and cutoffs everywhere in Sláinte, never tuned per product.
The 2023 nutrient profiling model, using the figures printed on the pack.
Caps and floors that stop a category gaming the calculation.
Every food score out of 100 is built from three parts. These are the exact shares the app uses.
Nutrition quality
55%
Ingredients
30%
Processing and quality signals
15%
| Part | Share | What it measures | Why it carries this weight |
|---|---|---|---|
| Nutrition quality | 55% | Energy, sugars, saturated fat and salt, set against fibre, protein and fruit, vegetable and pulse content. | It is the part of a product that is actually measured and printed on the pack, so it compares fairly across every brand. |
| Ingredients | 30% | Additives, artificial sweeteners, how long the ingredient list is and whether any ingredient is a known concern. | Two products with the same nutrition figures are not equal if one of them is mostly additives. |
| Processing and quality signals | 15% | Degree of processing, whether fibre and protein are present at all, and organic certification. | A supporting signal that nudges the result, never a verdict on its own. |
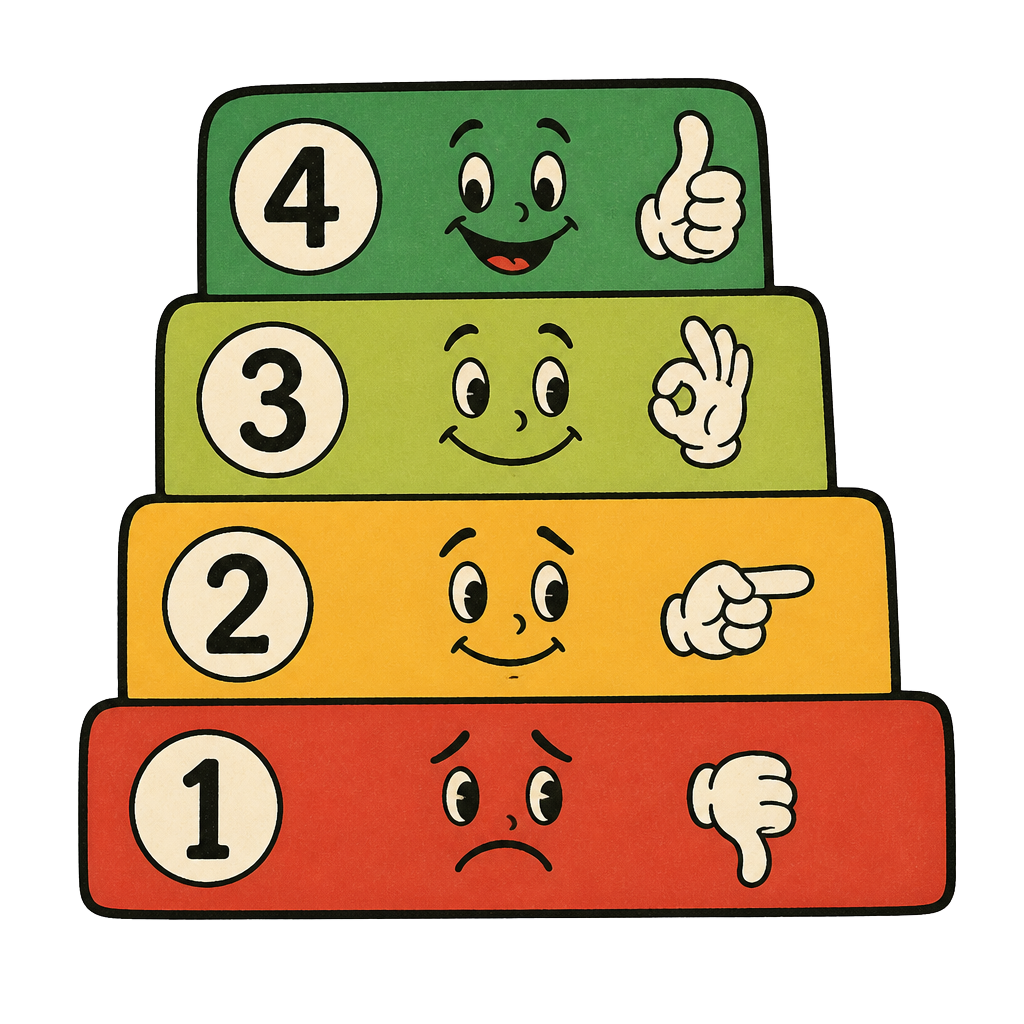
The final number falls into one of four bands. The cutoffs never move.
| Band | Score | What we say | What it means |
|---|---|---|---|
| Excellent | 75 to 100 | Good for you. | A strong overall profile according to the Sláinte methodology. |
| Good | 50 to 74 | Mostly good for you. | A generally favourable profile, with some characteristics worth understanding. |
| Poor | 25 to 49 | Best kept occasional. | A weak profile. Several characteristics pull the score down. |
| Bad | 0 to 24 | Avoid. | A poor profile according to the Sláinte methodology. |
The nutrition part uses the 2023 nutrient profiling model behind Nutri-Score. Points are added for the things worth limiting, taken away for the things worth having, and the total is then mapped onto a 0 to 100 scale. Drinks, fats and oils and cheese each use their own thresholds.
Counts against the score
Salt
up to 34 points
Sláinte extends the scale past 4 g per 100 g
Sugars
up to 15 points
Lower thresholds again for drinks
Energy
up to 10 points
Kilojoules per 100 g or 100 ml
Saturated fat
up to 10 points
Measured as a share of total fat for oils
Counts for the score
Protein
up to 7 points
Not counted when negatives are already high, cheese aside
Fibre
up to 5 points
Rewarded from 3 g per 100 g upwards
Fruit, vegetables and pulses
up to 5 points
Up to 6 for drinks
| Term | What it means here |
|---|---|
| Negative points | Points from energy, sugars, saturated fat and salt per 100 g or 100 ml. More points is worse. |
| Positive points | Points from fibre, protein and fruit, vegetable and pulse content, subtracted from the negative total. |
| The protein rule | Protein points are not counted once a product is already high in negatives, so a salty, fatty product cannot buy its way back with protein. Cheese is the exception. |
| The salt extension | The published salt scale stops at 4 g per 100 g, which makes table salt look like a salty sauce. Sláinte keeps counting beyond that point. |
| Mapped to 100 | The points total is converted to a 0 to 100 nutrition score, so a lower points total becomes a higher Sláinte number. |
Some categories look better per 100 g than they are in real life. These caps and floors are applied after the calculation.
| Rule | Why |
|---|---|
| A product finishes at most 15 points above its own nutrition score | A short, clean ingredient list cannot rescue poor nutrition. |
| Artificially sweetened products stop at 74 | Swapping sugar for sweeteners is not the same as a genuinely good product, so it is never shown as Excellent. |
| Dense sauces, dressings and condiments stop at 49 | Per 100 g figures flatter things eaten by the spoonful. |
| Fried and extruded savoury snacks stop at 49 | Crisps are crisps, whatever the pack says about them. |
| Dense cakes, pastries, biscuits and confectionery stop at 24 | A donut with missing nutrition data is still a donut. |
| Single ingredient, additive free, unprocessed foods never fall below 55 | Honey, nuts, plain yoghurt and olive oil are never ranked under an ultra processed snack. |
| A high concern ingredient overrides the band entirely | The verdict becomes "Avoid, contains a high concern ingredient." no matter what the maths said. |